What is a phylogeny?
Phylogenies show the evolutionary relationships among a series of organisms, which can be graphically represented by phylogenetic trees. Phylogenetic trees are created to show relationships, but a more specific diagram that uses branch length to show evolutionary distance is called a phylogram. Both of these visual representations are created by comparing sequence data from DNA, RNA or proteins, and can either be based on the entire genome of organisms, or can be created based on specific short sequences, such as a single protein or DNA regions [1].
To learn more about vocabulary behind phylogenetic trees, please see the explanation on the Protein Phylogeny Page. Sequence Alignment
How do you perform an alignment?
A sequence alignment allows you to compare multiple sequences to infer homology and their evolutionary relationships. Clustal Omega, MUSCLE, and T-Coffee are some of the many Multiple Sequence Alignment (MSA) programs available to compare three or more protein or nucleic acid sequences [2]. By inputting a series of FASTA codes, these programs use algorithms and statistical analyses to identify the best alignment method for a series of sequences. To statistically identify a best-fit sequence alignment, you can either use percent identity (PID) or BLOSUM62. PID takes into account the number of actual matches in your sequences, whereas BLOSUM analysis involves a matrix that creates a likelihood score for the event that an amino acid switch would occur between alignments. Phylogenetic Trees for Homo sapiens MEFV variant 1 using Clustal Omega |
|
Analysis
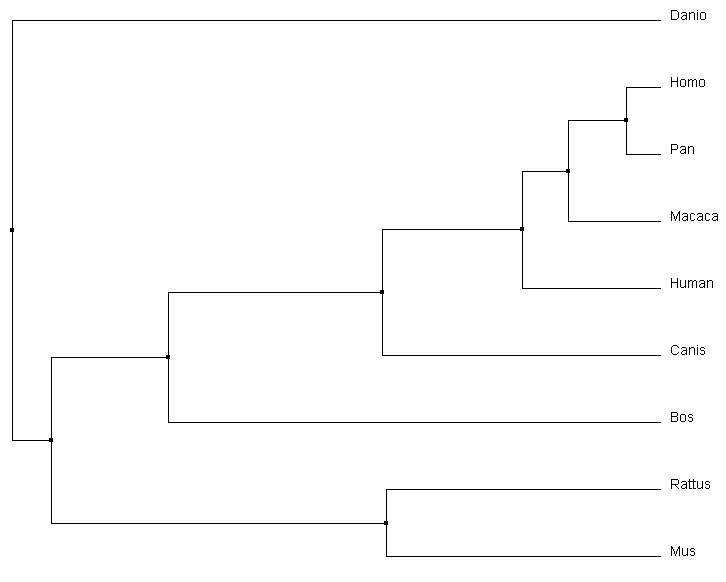
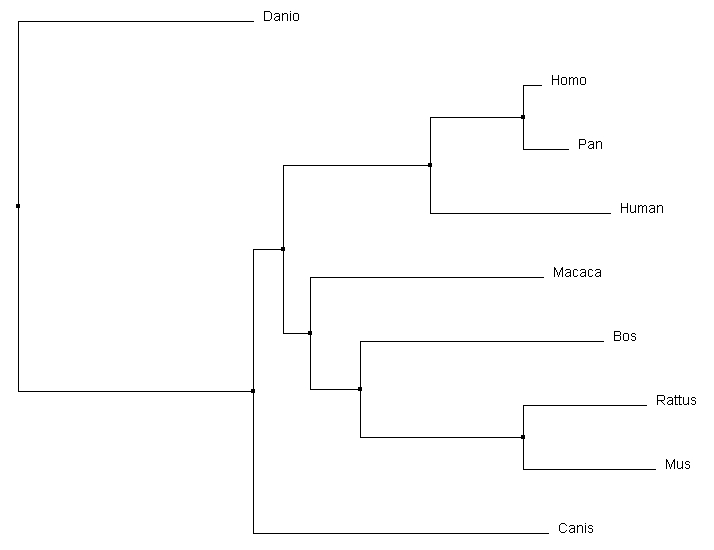
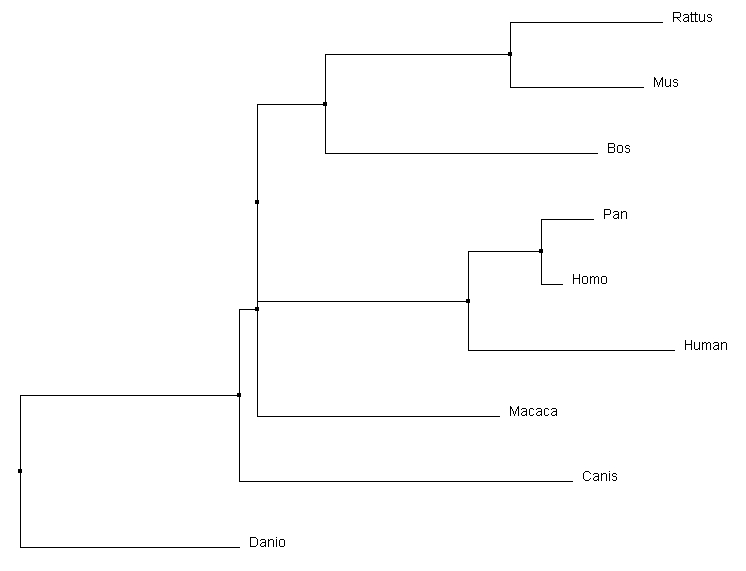
The phylogenetic trees produced through different calculation methods have a number of similarities. All of the programs correctly identify Danio as the outgroup, and have the same primate core including both human variants of the gene and Pan. All four calculations also identify that Rattus and Mus are most similar, putting them together on a branch together. However, the more accurate alignments can be detected through subtle changes in the relationships depicted in the phylogenetic tree. For example, the Macaca relationship changes dramatically depending on the type of alignment calculations being performed. In the average distance using percent identity, Macaca is closely associated with focal gene, human MEFV variant 1. Relative to that, the average distance using a BLOSUM62 matrix depicts it on a different branch and most comparable to the Bos gene. The neighbor joining tree using a BLOSUM62 matrix was selected to compare to other alignment programs for consistency with the Protein Phylogeny Page. Comparison with Other Alignment Programs |
|
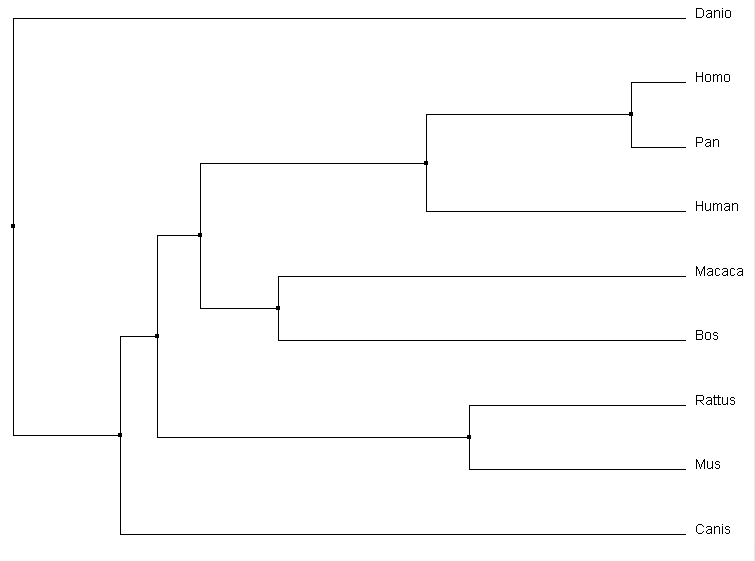
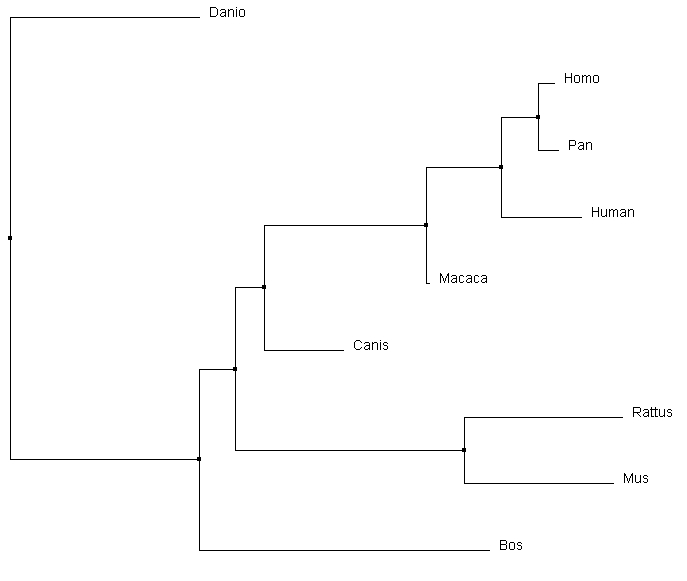
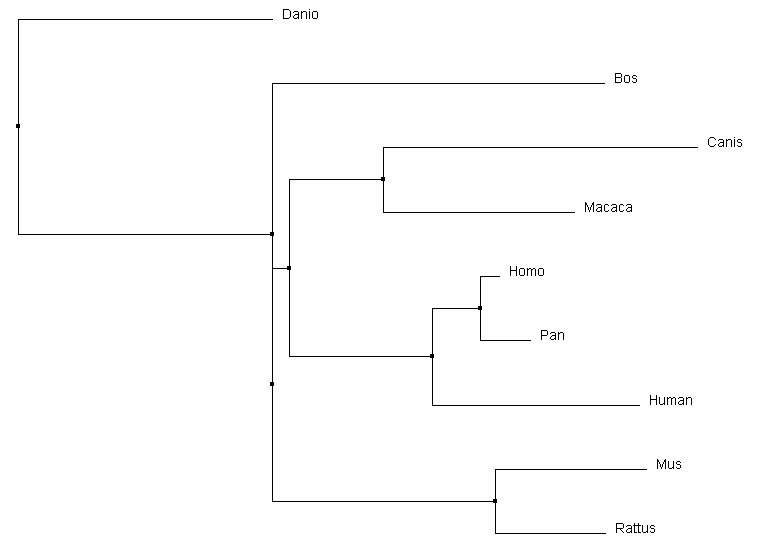
All the alignment programs created very similar trees. The most interesting difference was the relative relationship of Canis to the other core organisms. Clustal omega and MUSCLE both similarly determined it was a secondary out group to the core of the tree. T-coffee however depicted it as having a common ancestor with Macaca, which in turn had one with the core primates. Considering the protein domain structure of the Canis homolog, it could be plausible that it has a more similar DNA sequence than either mouse or rat to the core primates. Most other main relationships were preserved between different alignment sequence tools.
FASTA sequences for homologs of Homo sapiens MEFV variant 1 FASTA sequences used for comparison are elaborated more fully on the Gene Homology Page.
|
|||
